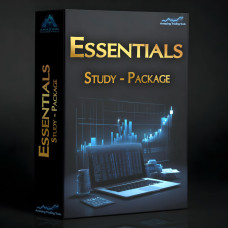
Essentials Study Package – 16 Custom Studies
The Essentials Study Package provides 16 versatile studies to enhance your market analysis with Sierra Chart. This collection includes a wide range of tools to customize Sierra Chart to your needs and improve your trading workflow.
Included Studies:
- AussenStab
- AussenStabZigZag
- AussenStabZigZag Overlay
- BarVWAP
- Chart Title
- Daily Preparation Points
- EMU Marker
- ExtendBarPOC
- InsideBar/OutsideBar
- Klaus OB&AS IB&AS Marker
- Klaus Up/Down Volume Difference
- MarketEvents
- Multi ATR
- MultiTimeRangeHighlight
- OliMP
- Price Line Countdown
For activation, it is necessary that you correctly fill in the "Sierra Chart Account Name"
which can be found in Sierra Chart under Help -> About.
While the download link is available immediately, please note that activation may take up to 24 hours.
In most cases, activation is completed much sooner.
! Disclaimer & Limitation of Liability !
By purchasing and using this software you acknowledge and agree to the following:
• All products are provided "as-is", with no guarantees or warranties of any kind.
• I am not responsible for any financial losses, trading outcomes, or damages resulting from the use of my software.
• Trading involves risk, and you alone are responsible for your trading decisions.
• This software is designed to assist with analysis but does not guarantee profits or prevent losses.
• It is your responsibility to ensure that you understand how to use this software correctly before making trading decisions based on its output.
AussenStab:
- Displays ThrustBars or OuterBars (AussenStab) in the chart with or without extensions.
- Alarm function available for each OuterBar or for OuterBars in opposite direction (color change).
- Marker for each OuterBar or only on color change.
- TRK (AS) / HGK (AS)
AussenStabZigZag:
- Like „AussenStab“, but with an additional ZigZag line based on OuterBars.
- Various "Coloring Modes" for the ZigZag, e.g., HH+HL, LH+LL, WaveCount, etc.
- Higher/Lower labels can be displayed.
- Adjustable calculation times.
- TRK (AS) / HGK (AS)
- And much more ...
AussenStabZigZag Overlay:
- Transfers the "AussenStabZigZag" to another chart.
- OuterBars from the other chart can also be displayed.
Example: Display the ZigZag from the M15 chart in the M3 chart.
BarVWAP:
- VWAP of individual candles.
Chart Title:
- Short names for chart tabs (Chart title).
- Adjustable elements: Prefix, Symbol (character adjustable), Timeframe, Suffix.
Daily Preparation Points:
Marks several key points in the chart, including:
- Yesterday’s close
- Night session open
- Previous day's VWAP
- High/Low of the current and previous day
- Daily ATR
EMU Marker:
- Detects and displays EMUs (Exhaustion Pattern).
ExtendBarPOC:
- Displays POCs of individual candles with points and extension lines.
Optionally only open or all POCs. - Lines can also be displayed with text (date/time, etc.).
- Multi POCs (up to 3).
- Cluster.
- Bid/Ask POCs.
- Spreadsheet output of open POCs is possible.
InsideBar/OutsideBar:
- IBs and OBs in one study.
- Extension lines from the POC or midpoint possible.
- Lines can also be displayed with text (date/time, etc.).
- Additional markers for IBs and OBs adjustable.
Klaus OB&AS IB&AS Marker:
- Marks OBs that are also AS(OuterBars), as well as IBs that are also AS.
Klaus Up/Down Volume Difference:
- Displays the up/down volume/tick difference as a number over the last (x) candles.
- Volume type selectable: Tick volume or Bid/Ask volume.
- Divergence can be highlighted.
MarketEvents:
- The study reads events (NEWS) from a spreadsheet and displays them as a list.
- Alarm function.
- Past NEWS candles can be marked.
- The spreadsheet (MEvents.scss) must be open in SC.
Example spreadsheet is included in the download.
Multi ATR:
• Standard ATR and two ATR multipliers (1.5x and 3x preset).
• Can also be used to control "Attached Orders":
- STOP = Multiplier 1 (e.g., 1.5x ATR)
- TARGET1 = Multiplier 2 (e.g., 3x ATR)
- TARGET2 = Multiplier 2 + adjustable ticks (Position size allocation if possible: Target1 = 2/3, Target2 = 1/3)
- Quick access for the "Attached Order" function via a custom button:
- Right-click on the button bar -> Customize Control Bar -> Advanced Custom Study Buttons -> Button10
MultiTimeRangeHighlight:
- Like the original Time Range Highlight but with 10 adjustable time ranges.
OliMP:
- Reads Oli's (Trading Coach Oli) MP data from a spreadsheet and displays it in the chart when the date matches the spreadsheet data.
to get this Market Profile Data follow Trading Coach Oli on SocialMedia (https://tradingcoacholi.com) - Best used on a daily chart and transferred to smaller timeframes using the "Study/Price Overlay" Study.
Example spreadsheet is included in the download.
Price Line Countdown:
- Countdown timer on the price line.
AS = AussenStab (OuterBars)
ATR = Average True Range
EMU = Erschöpfungsmuster (Exhaustion Pattern)
FW = Farbwechsel (Color change)
HGK = Höchst grüne Kerze (Highest green Candle)
HH = Higher High
HL = Higher Low
IB = InsideBar
LH = Lower High
LL = Lower Low
MP = Market Profile
POC = Point of Control
TRK = Tiefste rote Kerze (Lowest red Candle)
VWAP = Volume Weighted Average Price
OB = OutsideBar
Essentials Study Collection
- Product Code: Essentials Study Collection
- Availability: In Stock
-
25.00€ / Month
Available Options
Tags: SierraChart Study


